
Today in Edworking News we want to talk about We need visual programming. No, not like that.
Most visual programming environments fail to get any usage among developers. The primary reason for this failure is these environments attempt to replace code syntax and business logic, a task developers do not typically visualize. Instead, developers focus on visualizing state transitions, memory layouts, or network requests. Those working on visual programming would be more likely to succeed if they started with aspects of software that developers already visualize.
Every few months, a new visual programming language emerges, typically designed to replace pseudo-code. Despite initial excitement, these systems fade out without being mentioned again. One reason for the recurring attempts at visual programming is the belief that less experienced programmers might find it easier. However, tools meant for experienced developers, assuming familiarity with complex environments like npm and AWS, also fail.
Developers familiar with textual code representations prefer them to write and understand business logic. Observing developers' actual activities reveals they spend time visualizing essential and complex software aspects, not logic.
Several critical visualizations often encountered include:
- Memory Layouts: Knowing the exact data layout in memory is crucial since bad layouts contribute significantly to performance issues.
- External Dependencies: Understanding all external dependencies a code hits when responding to HTTP requests can prevent unpleasant surprises during outages.
- These visualizations are seldom default or seamlessly integrated into environments, even though visual tools like flamegraphs offer significant debugging benefits.
 Visual Programming Examples
Codebase Visualization: Tools like Sourcetrail, now inactive, helped navigate and understand large codebases by visualizing dependencies and interactions. Despite solving many design problems, such tools often experienced common visualization shortcomings.
Treemap Visualization: Jonathan Blow's treemap visualizes various codebase metrics such as code size and quality, offering significant insights, especially in massive codebases. These metrics help developers understand the structure and prioritize areas during onboarding or optimization.
Code Retention Diagrams: Visualizing codebase evolution over time, like in Rich Hickey's paper on Clojure, helps in understanding long-term project trends and changes.
Computer Networks and Service Topologies: Diagrams illustrating network and service topologies, heavily utilized in AWS documentation, clarify service interactions and dependencies, essential for understanding complex infrastructures.
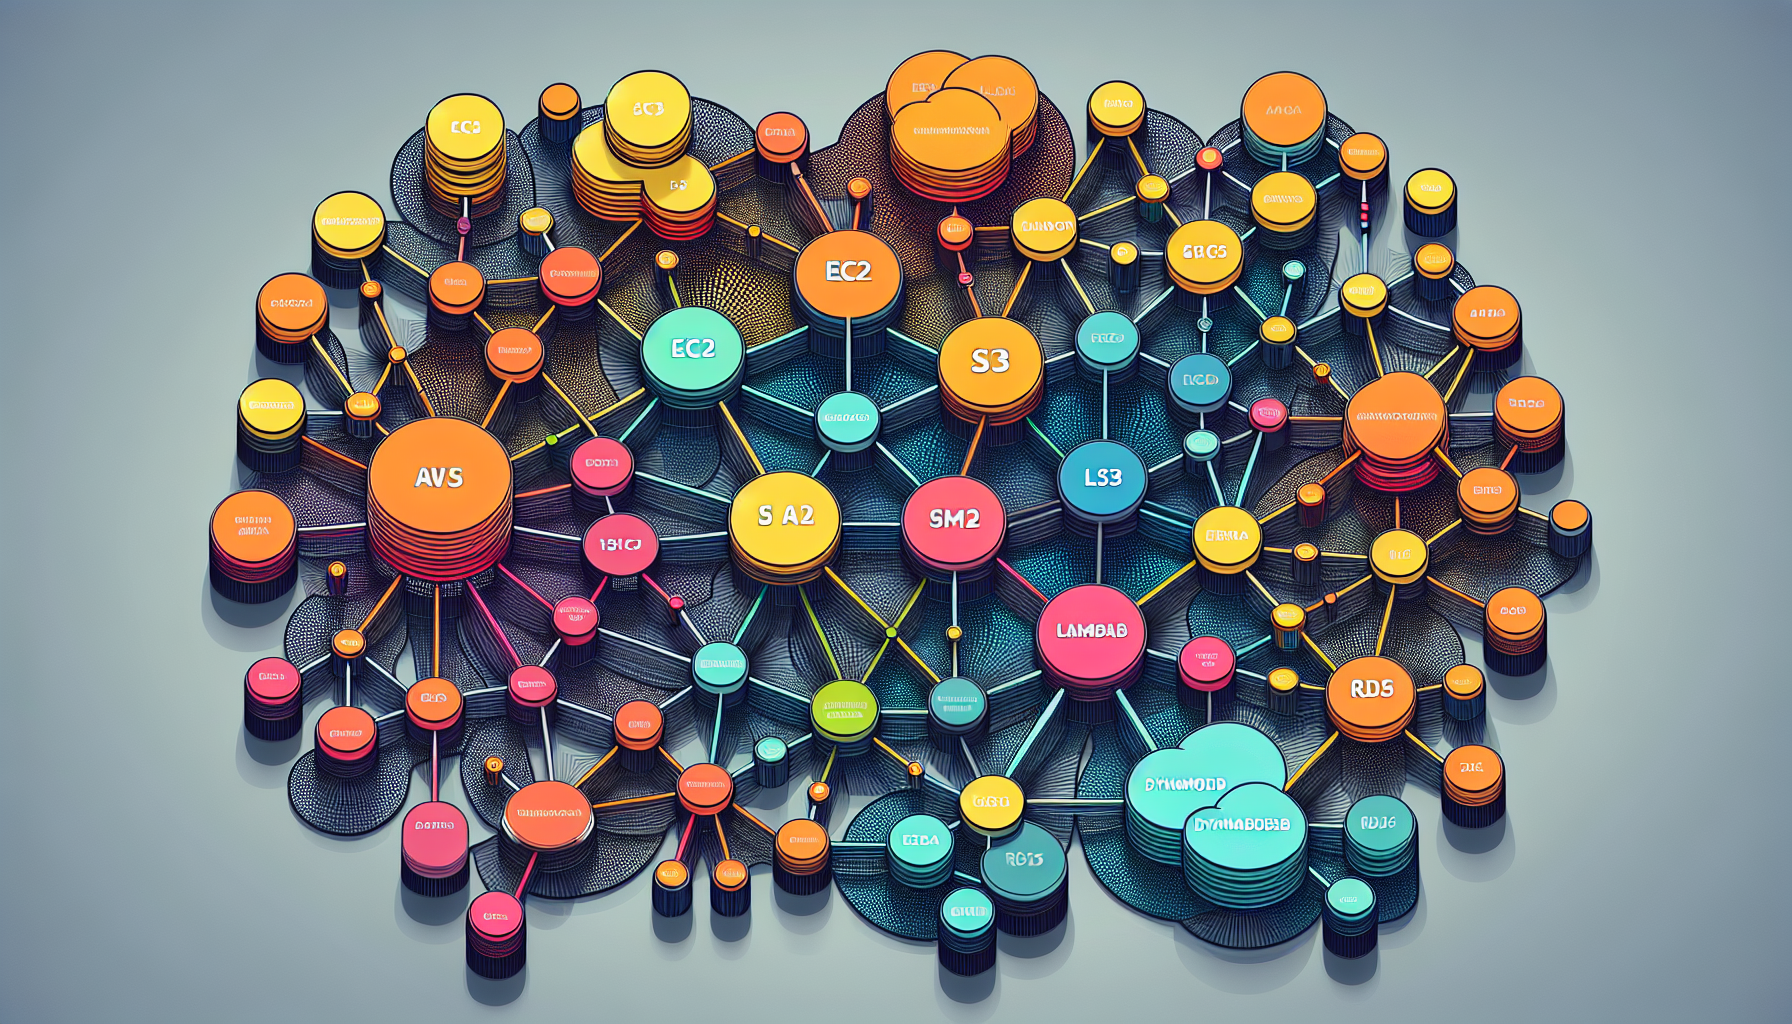
An example of AWS service topology diagrams.
Memory Layouts in Programming: Diagrams representing memory layout, as seen in discussions about Rust programming, help developers form accurate mental models critical for performance optimization.
State Machines: For instance, Stripe's PaymentIntents state machine diagram illustrates the various states and transitions involved in a payment process, simplifying the understanding of complex workflows.
Swimlane Diagrams for Request/Response Architecture: These diagrams, like those used in Stripe documentation, track client-server interactions, showing the sequence, dependencies, and roles.
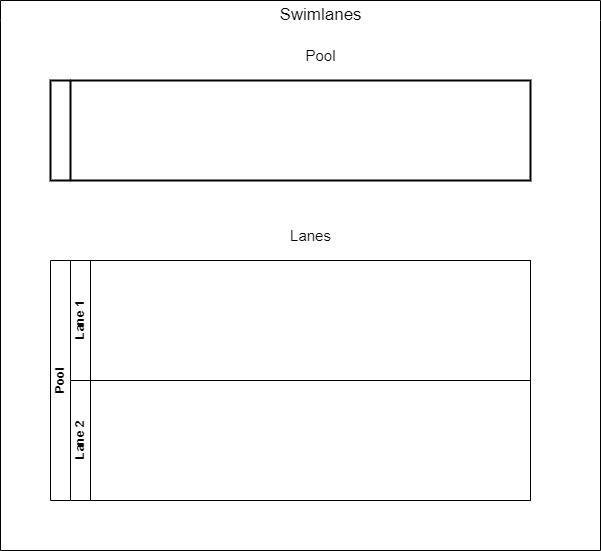
Example of a Swimlane diagram showing client-server interactions.
Generating diagrams from code annotations, end-to-end tests, or state machine logic directly would provide accurate and insightful visuals, leading to improved debugging and understanding of software operations.

Remember these 3 key ideas for your startup:
- Visualize what matters: Focus on creating visual tools that help with state transitions, memory layouts, and network requests. Understand what developers already visualize and build tools tailored to these needs.
- Improve problem-solving: Use visualization tools like Sourcetrail or Treemap to break down complex codebases, track their evolution, and see performance-enhancing layouts. This approach can help identify bottlenecks and critical dependencies swiftly.
- Leverage diagrams in documentation: Utilize swimlane diagrams, state machines, and network topologies to document processes visually. This strategy aids in quicker understanding and reducing errors during the development and maintenance phases.
Edworking is the best and smartest decision for SMEs and startups to be more productive. Edworking is a FREE superapp of productivity that includes all you need for work powered by AI in the same superapp, connecting Task Management, Docs, Chat, Videocall, and File Management. Save money today by not paying for Slack, Trello, Dropbox, Zoom, and Notion.
---
- A sleek visual programming language that replaces pseudo-code.
Visual programming remains a promising field waiting for the right approach. By focusing on what developers already find useful and integrating these aspects into their tools, we can finally realize the true potential of visual programming.
For more details, see the original source.