Project management can be a daunting task for many individuals and organizations. It involves coordinating various teams and resources to ensure that a project is completed on time and within budget. However, the struggle of project management is real, as it often involves dealing with numerous challenges such as scope creep, changing priorities, and resource constraints.
Fortunately, there is a tool that can help project managers overcome these challenges and better manage their projects. This tool is called the S-curve, and it can provide valuable insights into a project's progress and potential roadblocks. In this article, we will explore the benefits of using the S-curve in project management and how it can help project managers achieve their goals.
 What Is a S-Curve in Project Management
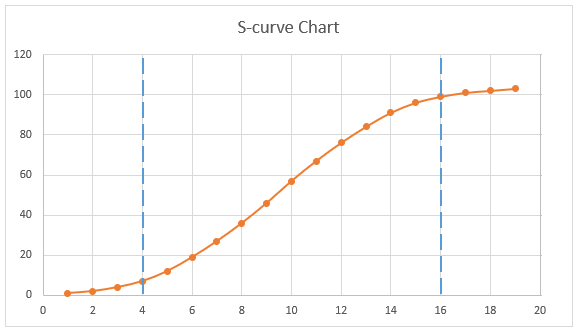
"The S-curve is a graphical representation of a project's progress over time" (Kerzner, H. 2017. Project Management: A Systems Approach to Planning, Scheduling, and Controlling. John Wiley & Sons). It is often used in project management to track the progress of a project and identify potential issues or roadblocks. The S-curve is typically plotted on a graph, with the x-axis representing time and the y-axis representing the project's progress. As the project progresses, the graph will show a gradual upward slope, representing the project's initial slow start and gradual increase in productivity. As the project nears completion, the graph will show a steep upward slope, indicating a rapid increase in productivity.
The S-curve is called an S-curve because, when plotted on a graph, it resembles the letter S. The shape of the S-curve can vary depending on the project, but it typically shows a slow start, followed by an acceleration in progress, and then a slowing down as the project nears completion.
The S-curve is a valuable tool for project managers, as it provides a visual representation of a project's progress over time. This allows project managers to track the project's progress and identify potential issues or roadblocks. Additionally, the S-curve can be used to compare the actual progress of a project with its planned progress, providing valuable insights into the project's overall performance.
Why an "S"?
The S-curve gets its name from its shape, which resembles the letter "S." The S-curve starts off with slow progress in the initial stages of the project, followed by an acceleration phase as the project gains momentum. Once the project reaches its peak, progress starts to slow down as the project nears completion. This shape is similar to an S, hence the name "S-curve."
The S-curve is particularly useful in construction projects, where progress is typically slow at the beginning of the project as workers prepare the site and lay the groundwork. As construction progresses, progress accelerates as the building takes shape, and it reaches its peak as the building is completed. After completion, progress slows down as workers finish up the details and prepare the building for use.

S-curve types
"There are three types of S-curves that project managers use to monitor and control their projects" (PMI. 2017. A Guide to the Project Management Body of Knowledge, PMBOK® Guide–Sixth Edition. Project Management Institute). These are the cumulative S-curve, the incremental S-curve, and the comparative S-curve.
- The cumulative S-curve is the most commonly used S-curve. It shows the cumulative progress of the project against time. It is used to monitor the overall progress of the project, and it helps project managers to identify whether the project is on track or not.
- The incremental S-curve shows the incremental progress of the project against time. It is used to monitor the progress of specific activities or tasks within the project. It helps project managers to identify which activities or tasks are taking longer than planned and take corrective action.
- The comparative S-curve shows the progress of two or more projects on the same S-curve. It is used to compare the progress of different projects against each other. It helps project managers to identify which project is performing better and take corrective action if necessary.
What are the typical applications of the s curve in project management?
The s-curve is a versatile tool that can be employed for various purposes throughout the duration of a project. Some key applications of the s-curve are:

Comparing the quantity of output
Another significant application of s-curves is to assess the quantity of output that a project will produce. This is especially common in the construction and manufacturing industries.
Forecasting cash flow
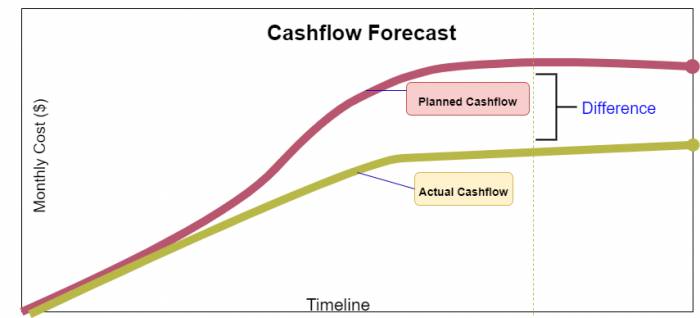
Another use of s-curves is in developing cash flow forecasts and predicting the impact that changes in cash flow will have. Cash flow refers to the timing and movement of cash in relation to tasks and events that occur during the execution of a project.
The cash flow curve is useful for stakeholders because it allows them to evaluate the need for cash and the actual timing of payments that are due under the obligations accepted by the company. This is the most important benefit of drawing a cash flow curve.
Evaluating performance and progress
The primary use of s-curves is to assess the progress and performance of a project through the use of Earned Value Management (EVM).
S-curves are typically created as part of the Earned Value Management System (EVMS) process and serve as the foundation for evaluating a project's progress and performance. To determine the current status of the project and make future predictions, a number of factors need to be considered, including:
- Performance Measurement Baseline (PMB), also known as Planned Value
- Earned Value
- Actual Cost
To generate results, all of these factors must be compared to the planned s-curve. This comparison is useful because it allows you to quickly determine whether the project is exceeding the budget or if a task is behind schedule by simply looking at the graph.
Schedule range of possibilities, also known as banana curves
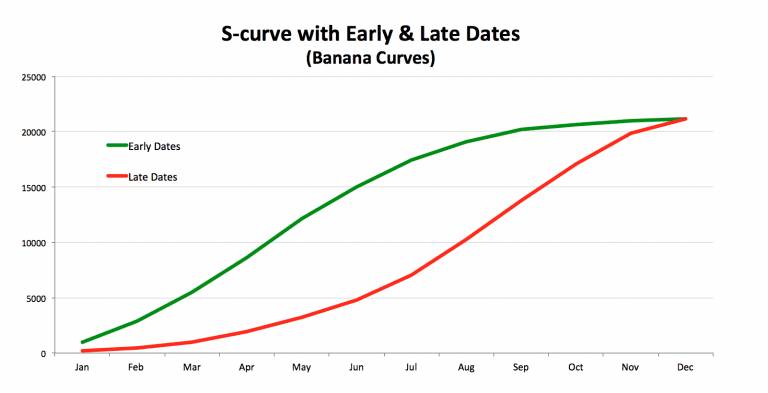
This is perhaps the most important use of s-curves. Most scheduling software can easily generate s-curves based on parameters such as quality, man-hours, and cost, which can help determine the range of possibilities for when the project can be completed on time. The software can produce two types of s-curves: one based on early dates and another based on late dates. These s-curves usually overlap at the beginning and end of the project, forming a shape that resembles a banana, hence the name "banana curves."
The lines of an S-Curve
Front-Loaded S-Curve
An s-curve that is front-loaded starts off steeply and then gradually levels off. It has a fast beginning and more time and resources are invested in the initial phase of the project. This type of s-curve might occur in projects that have a lot of repetition and require minimal planning and preparation time. Front-loaded curves are often seen in projects that were rushed from the start.
Back-Loaded S-Curve
Back-loaded s-curves start off with a lower slope and gradually become steeper as the project progresses, with the majority of resources expected to be used later in the project. This type of s-curve indicates that there was extensive planning and design at the beginning of the project and a shortened development time.
How does it help?

There are numerous ways that S-curve can be a big help to your project. Using the S-curve in your projects can provide numerous benefits, including improved project tracking, better risk management, and enhanced communication with stakeholders. Here are four compelling reasons why you should give the S-curve a try on your next project:
- The S-curve helps project managers track the progress of a project over time. By plotting the project's progress on a graph, project managers can see the overall trajectory of the project and identify any potential issues or roadblocks. This allows project managers to take corrective action and ensure that the project stays on track.
- The S-curve can be used to compare the actual progress of a project with its planned progress. This allows project managers to identify any discrepancies between the two and take corrective action as needed.
- The S-curve can be used to identify potential risks or opportunities for a project. By analyzing the shape of the S-curve, project managers can identify potential areas where the project may encounter challenges or opportunities for growth.
- The S-curve can be used to communicate the progress of a project to stakeholders. By providing a visual representation of the project's progress, project managers can easily communicate the project's status to stakeholders and keep them informed of any potential issues or roadblocks. Plus, the S-curve is a fun and engaging way to track the progress of a project!
How to create an s-curve in project management?

Creating an S-curve in project management is a simple and effective way to track the progress of a project over time. By plotting the project's progress on a graph, project managers can see the overall trajectory of the project and identify any potential issues or roadblocks. To create an S-curve, you will need a tool that allows you to create a line chart, such as Microsoft Excel or Google Sheets. Once you have the appropriate tool, follow these steps to create an S-curve:
- First, create a new blank worksheet. Then enter the data for your project into the worksheet. This will typically include the dates for each milestone or task in the project, as well as the planned and actual progress for each milestone or task.
- Once you have entered the data for your project, select the data and go to the Insert tab. From the Charts section, select the Line chart option. This will create a line chart of your data, which will be the basis for your S-curve.
- Finally, customize the chart to create the S-curve. This will typically involve adjusting the x-axis to display the dates for each milestone or task, and the y-axis to display the project's progress. You can also add additional data, such as the planned progress for the project, to the chart to provide a more complete picture of the project's progress.
Conclusion
The s-curve is a vital tool for project management that helps project managers track the progress of a project and identify potential issues or roadblocks. It provides a visual representation of a project's progress over time, allowing project managers to compare the actual progress of a project with its planned progress and make informed decisions about the project's overall performance. The s-curve can be used for a variety of purposes, including evaluating performance and progress, forecasting cash flow, comparing the quantity of output, and determining the schedule range of possibilities. Whether you're in the construction or manufacturing industry or just trying to better manage your projects, the s-curve is a tool that can help you achieve your goals. It is a versatile tool that can be employed throughout the duration of a project, providing valuable insights into a project's progress and potential roadblocks. So the next time you're tasked with managing a project, consider using the s-curve to help you overcome challenges and successfully complete your project on time and within budget.
If you're looking for a user-friendly collaboration platform for your team and business, Edworking is the perfect solution. It offers a variety of features that can boost your team's productivity, resulting in more successful projects. Give Edworking a try for free today and see the benefits for yourself!